 Insurance
 Construction
 Financial Services
 Mobile
 Health Care
 Real Estate
 Project Management
 Other
Other
 Client Background
The client is a commercial real estate firm focussing in the Retail industry with primary clients as retail tenants and landlords.
Across the globe, there is disruption in the Retail sector of the Commercial Real Estate with more malls, restaurants, bars, food and beverage properties opening or expanding to meet growing demands for these services, as a result of an ongoing demographic shift in how and where people live, work and play. One of the key components of the Retail Real Estate model are the brokers who eventually help in the sale or lease of these properties enabling everyone make profits including sale/lease commissions. The calculations of their commissions based on escalating splits can be quite complex with the growth in property deals transactions.
 Challenges
Our retail real estate client currently store Charge slips and Sale transactions details in a database through a web application. Additionally, they also maintain Lease terms, Commission details and Commission split calculations for the Charge slips. The application has a Reporting module but that is just tabular reports to list the charge slips, commission due and payment transactions. This does not provide them the ability to introspect and analyse their data for decision making and improving on their sales and lease commissions.
 Solutions
We proposed that a Business Intelligence tool like Power BI could help transform their data to provide more meaningful analysis of their data so that they could have a better perspective of their Sales/Lease and commissions. The excellent features of Power BI like interactive dashboards, drill down and drill up capability, Natural language, Custom Visualization make it a more suitable tool than its competitors.
We developed an interactive dashboard report in Power BI that helps them visualize and get an analysis of the total deals, gross receivables and post-split receivables along with the following insights:-
- Geographical distribution of Charge Slips:- We represented the Charge slip location of the Retail stores on an interactive drill down map which now helps them analyse the State/City where they are making sales commissions versus the locations where they have low or no penetration. We can further combine this with the data where they get leads but are not converted into sales. This would help them strengthen their team and efforts towards gaining more business in such locations.
- Commissions comparison by past years and current year:- A pie chart representation of the Commissions for the past and current year gives a quick view of how they are progressing year on.
- Broker performance comparisons:- A tabular chart of all the Internal brokers in terms of the number of charge slips they are associated with and their Commissions due helps compare the Brokers performance. It also provides the ability to select a specific broker and then interactively just view the other charts for the selected broker.
- Break up of Charge slips by deal designation type:- A column chart represents the breakup of commissions earned or due for Landlord and Tenant designation types.
 Business Value
The admin users as well as the internal brokers get access to this interactive dashboard to see their data in action and help gain insights that drive them to make better, well informed decisions like broker allocations and penetration to different locations to market retail properties for improving their business revenue by way of maximizing commissions.
A glimpse of the Dashboard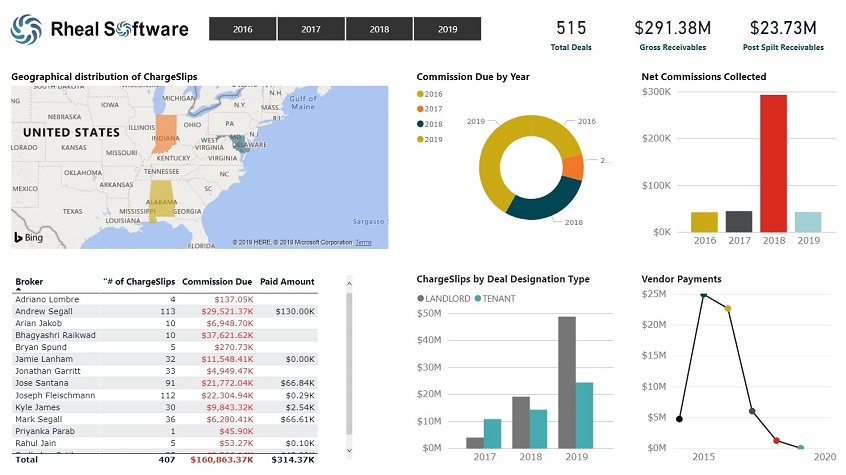
Contact us to transform your data into an interactive Power BI Dashboard