 Insurance
 Construction
 Financial Services
 Mobile
 Health Care
 Real Estate
 Project Management
 Other
Other
 Client Background
The client is a Property Claims Management company with a large network of Service providers providing customized property claims solutions. They are an extension of their Client's team and deliver on their client's metrics and goals.
 Challenges
Prior to Power BI, our Claims management client relied on long running tabular reports and exporting these reports to excel. They then used the data from the excel to transform into vital information for analysis using Power Pivot to create tables and graphs. These methodologies however offered a restricted capability to analyze and explore the data without drill down support to comprehend the data at a detailed level. Faster claims processing is a challenge for any Claims management company but with the enormous amount of data and variables to understand the trends and patterns requires more than the skills of experts and traditional tools.
 Solutions
Our understanding was that Business Intelligence would provide us the solution to gain insights into the data and after exploring several tools, we arrived at the conclusion that nothings fits better than Power BI. The powerful features of Power BI like Interactive Dashboard reports, Data models, Natural Language, Custom Visualization DAX functions etc. make it the go to tool for BI.
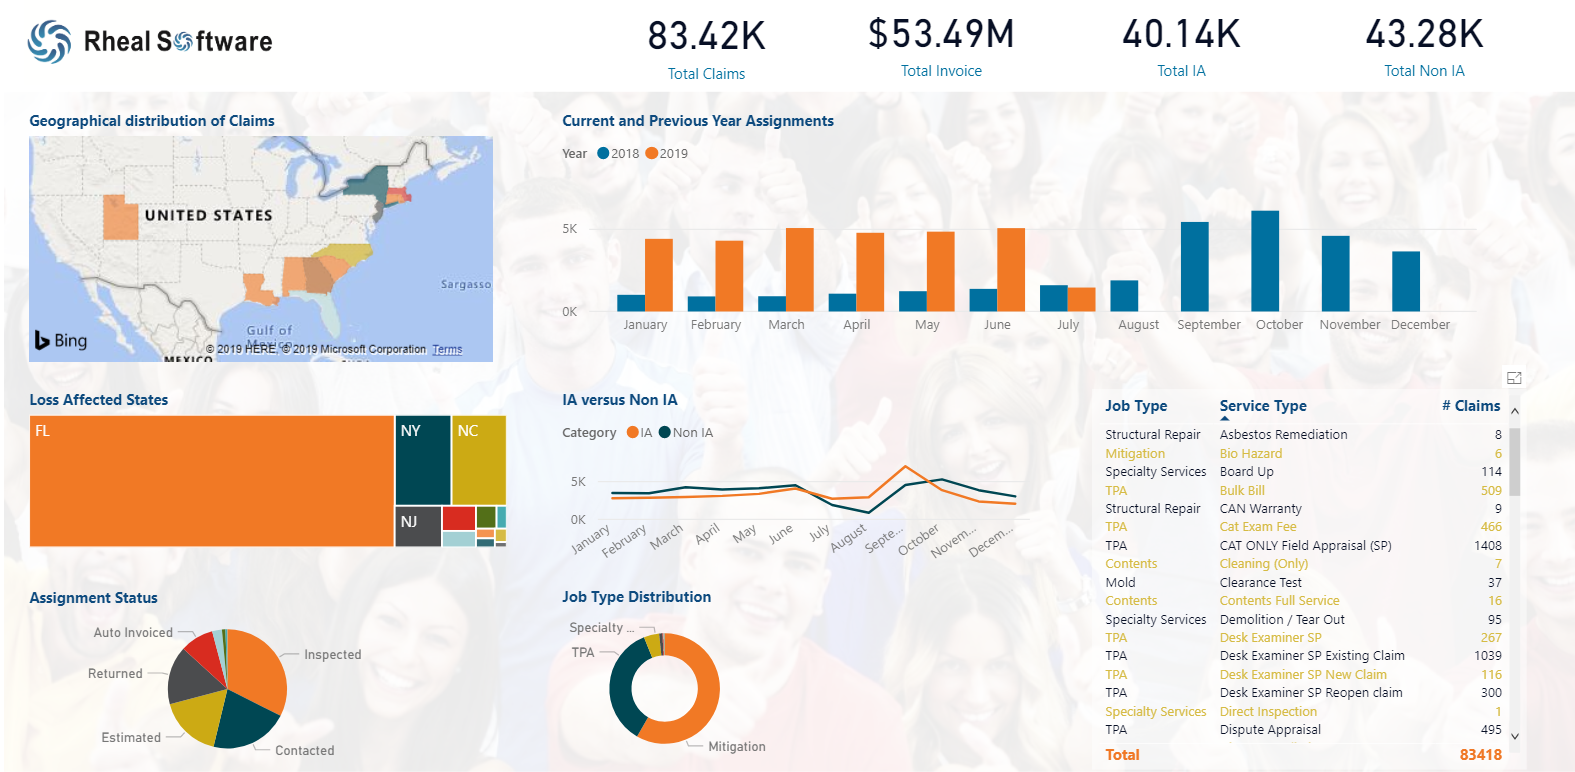
We leveraged on the capabilities for Power Bi to create an Interactive Dashboard report that unlocks a variety of business insights: -
- Helps analyse the Claims distribution in specific regions (City, State, Zip): - We represented the claims concentration visually on a map. This helps to analyse which region (State/City/Area) have the maximum claims generated. A tree map representation of the geographical regions utilizes the interactive drilldown capabilities of Power BI to get information that is more detailed.
- Categorize and breakdown Claims by Job Type/Service Type: - Provides insights into claims generated for a specific Job Type/Service Type e.g. Structural Repiar / Dwelling Build Back.
- Help find the claims that are currently in a specific Status: -A pie chart to analyse the claims in a specific life cycle status. Clients can easily differentiate between Open versus Closed claims and take actions on Open claims.
- Get a summary of the claims and revenue generated by Region, Category etc: - A quick snapshot of the number of claims and revenue generated that dynamically changes with Region and Job Type / Service Type.
A glimpse of the Dashboard
 The Result
Customers get to view the desktop and mobile friendly interactive dashboard powered by Power BI that provides them access to actionable information that quickly helps them analyze their claims data so that they can then efficiently manage their claims processing workflow.